

Even if you’re not a football fan, you may have seen the recent successes of Liverpool F.C. Having won the Champions League in 2019 and the Premier League in 2020, they’re now considered one of the best teams in the history of the modern game. And if like me you know a Liverpool fan, you will be reminded of this pretty often.
Unsurprisingly, this happened through the combination of a top-rated manager, and a squad of world-class talent. But if you’re an inquisitive person you may ask yourself, how were they able to get this squad of superstars?
Like many top sports teams across the world, Liverpool have taken cues from leading digital companies. In 2016 they appointed four data analysts, placing an emphasis on data analytics in order to gain a competitive edge. In collaboration with Liverpool’s scouting team, who largely relied on traditional observational techniques to recruit players, they devised a new approach for deciding which players to purchase. In essence, Liverpool triangulated their research strategy.
What is research triangulation?
At Creative CX, we also hold a firm belief that the most rigorous and valuable insights are gained through a combination of qualitative and quantitative research techniques. This is really what we mean when talking about the triangulation of research. It’s the combination of multiple information sources to create well-informed problem statements.
Relying on a single research methodology can often leave you with a limited scope of findings, and can prevent you from being able to validate your findings. In this scenario you may find yourself in a rabbit hole, heavily relying on the words of the 1-2 users who encountered an issue, or interpreting data without any of the context that’s gained through qualitative techniques.
Adding a range of methodologies to your research plan, conducting them simultaneously and triangulating those findings can therefore help in building a bigger picture to how users are really interacting with your digital products and services. This additional data can also be used as a tool for prioritising problems more effectively, and convincing both stakeholders and management about the urgency of resolving the highest priority issues. Crucially, research triangulation also provides benefits when it comes to problem-solving. As you can only solve a problem effectively when you have a full triangulated understanding of an issue.
It’s important that this is done in a logical and structured way. Triangulating your research doesn’t mean doubling the number of usability tests you moderate, or running an extra survey every month. It’s about tactically choosing a broad range of research methodologies to incorporate into your research project. This means using qualitative and quantitative methods, but also ensuring a range of behavioural and attitudinal dimensions are used.
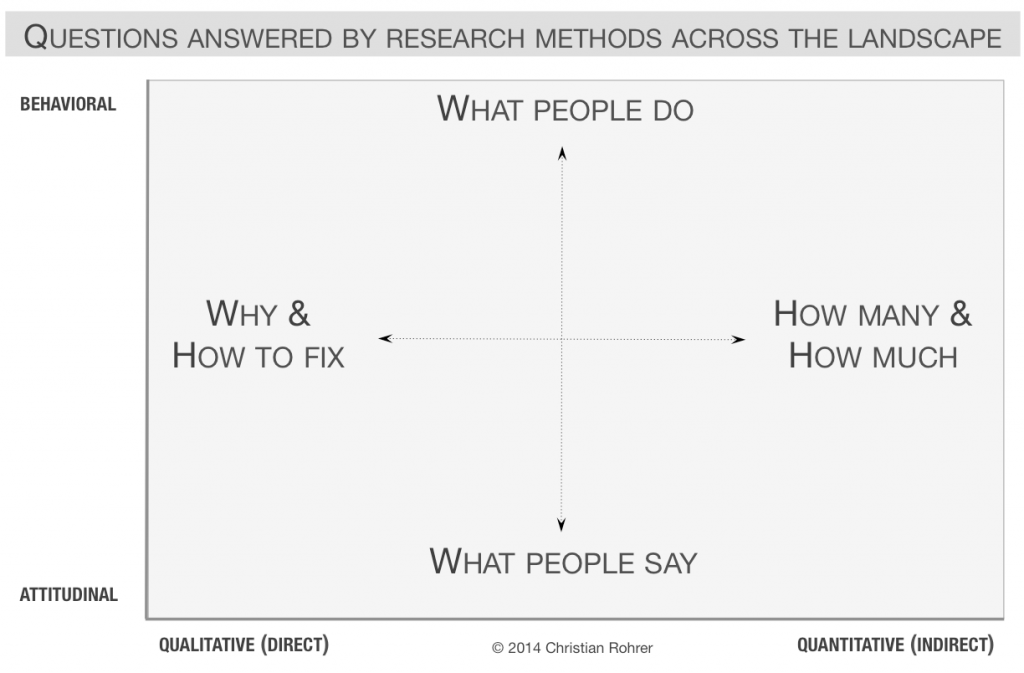
As illustrated in this diagram by the Nielsen Norman Group, behavioural insights focus on what people do, while attitudinal insights focus on what people say. This is an important distinction in user research. If you’ve ever watched usability testing, you may have observed a classic example where a participant states that “everything was great”, despite not being able to complete a single task in the session (always a frustrating moment for the moderator). As this example suggests, behavioural research methodologies are rightly the focus for usability studies. However, it’s important we don’t forget about these attitudinal insights. If we merely focus on observing how well existing aspects of the site are working, how are we supposed to identify missing functionality, content and other aspects that fall short of user needs?
As outlined in the following paragraph, it’s therefore important to choose methodologies that allow you to observe what users do, whilst being able to ask them questions about that behaviour.
Qualitative research
By undertaking qualitative research we crucially understand not only what issues are occurring, but why users find these issues frustrating, and why a user is behaving in a certain way. There are a number of techniques we use in our Opportunity Audits to uncover this rich level of insight, with some focusing on behavioural insights and others on attitudinal insights:
- Usability Testing: Usability Testing often provides the richest source of insight. By using moderation techniques such as “please think aloud”, we can gain attitudinal insights as well as the typical focus of behavioural insights. Employing advanced moderation techniques like mini-tasks and follow-on questions can also be used to increase the depth of evidence. Using these methods, we’re able to uncover the majority of User Experience issues (typically 50-60), with just 5-6 users. This also provides a healthy, cost-effective balance of effort vs impact.
- User Interviews: Key objectives when conducting user interviews include the uncovering of attitudinal insights around the users’ needs, motivations and triggers, mapping out the nuances of a customer journey and identifying the expectations for a brand. This creates an understanding of a brand’s perceived value and how well it’s currently solving its users’ needs. Whilst this can be done as a separate exercise, it can be useful to include this at the beginning of usability testing sessions so this feedback can be contextualised around the user’s behaviour in the digital journey.
- UX Heuristic Review: Whilst this method doesn’t involve any direct contact with users, heuristic reviews do an excellent job at helping to avoid any blind spots in your research. It allows you to understand all the nitty-gritty issues that may be missed in usability observations by using the trained eye of 2-3 UX practitioners.
Using a combination of qualitative research methods can help fill in any gaps in your research and add depth to issues that may have not been explored fully in one methodology. However, running qualitative research without supporting data can often leave the nature and severity of user experience open to interpretation and cognitive bias. More often than not, this results in a HIPPO (highest paid person’s opinion) having the final say rather than the prioritisation being driven by the outcomes of the research.
This is exactly what was occurring at Liverpool F.C. Like other major sporting teams, they relied on video clips (observing what people do) and scouting reports (listening to what people say) to drive their player transfer decisions. Whilst this technique has worked for many clubs for a number of years, it was prone to cognitive bias which has led to several high profile mistakes in the transfer market in the last 10 years.
To give you an example, in 2014 Liverpool finished in 2nd place after a highly successful season where they accumulated 84 points. To help them compete for the league title the following season they decided to invest, and spent £117m on nine players. One year later and the club fired their manager after finishing in 6th place with a meagre 62 points. By 2020, all nine of those players had been sold by Liverpool at a net loss of £103m.
The Role of Data
This highlights why it’s crucial to validate your findings with data and analytics. Doing so will reduce the likelihood of cognitive bias, allow you to identify how many users are affected by a UX issue, as well as the commercial impact that problem could be having. This ultimately allows you to prioritise which issues to tackle. There are a number of techniques we use in our Opportunity Audits that can help us uncover this data-driven insight when combined with qualitative methods.
A deep dive into your analytics platform is a great way to start a quantitative review of your digital journey. Among other things, reviewing your analytics allows you to identify who your user groups are, where they’re coming from and what devices they use. Crucially, you can also understand where users land, which pages they then visit and the performance of those pages. Not only does this provide unique insights into the performance of your platform, but it can focus your approach in other methodologies to help understand the ‘why’.
To further understand user behaviour on key pages, click and heat map analysis can quantify which in-page elements are interacted with, which are ignored and the extent to which users scroll. This is especially useful for identifying which elements of a page need rethinking, especially when compared against first-hand user insights.
Making use of close-ended questions in website polls is another great way of evaluating customer satisfaction across a larger sample size. By launching quick polls that feature just 1-2 questions, insights can be achieved rapidly without a large amount of planning required. As well as answering general queries about a specific page or feature, it can be targeted to clarify any ambiguous insights from your research, or to help make a decision when you fail to agree on a matter with your team.
Whilst the primary focus of A/B testing is to test hypothesised solutions to customer problems which have already been well defined, experiments can also offer ways to better understand the problem. Correctly setting up and analysing a range of secondary metrics can teach you a lot about how your user base behave with elements of your site. This insight can often be crucial if your experiment fails to provide a winning variation. If you would like to find out more about this then you can read our article on How to analyse your experiment results.
Challenges of doing this remotely
Now considering it’s 2021, it would be remiss of me to not mention the C-word. Like everything else across society, Covid-19 has impacted the approach we must take for UX research projects. Usability labs collect dust whilst we spend an increasing amount of time speaking to users on video conferencing tools. But like all human beings, we adapt. And with tools like Lookback we’re able to connect with participants online, invite stakeholders to observe, and make notes which are automatically time-stamped.
When consolidating our findings we’ve actually found some efficiencies have been gained, as our notes are already digitised. We’ve also found that research participants are naturally a bit more cheerful and open to discussion than they typically are in lab sessions. Perhaps after being locked up for so long, people now relish conversation with strangers. Or maybe it’s the comfort of being in their own homes.
This obviously doesn’t come without its challenges. Doing this all online means we lose an element of collaboration and discussion that’s just easier to have when you have a team sitting in a research lab together. Naturally the risks of technical difficulties are also increased. With low battery levels, poor wifi connections and screaming children in the background all becoming harsh realities.
Conclusion
Following a series of unquantified transfer decisions in the 2014-2015 season Liverpool finished in 6th place in the Premier League, fired their manager and reported a net loss of £19.8m. But having learnt from these mistakes, Liverpool implemented a data driven approach in the years that followed, with their new data analytics team working in collaboration with the scouting team to adopt a triangulated approach when researching player transfers. 5 years later and this strategy has translated to success both on and off the football pitch. Having won both the European Champions League, the Premier League and announcing a world record profit of £106 million. With players commonly being the biggest assets for football clubs, the Liverpool management team will also sleep easy knowing that according to Forbes, their squad is now worth a whopping £1.83 billion, an increase of over 500% since 2015.
As evidenced in this example, research triangulation is a powerful tool for generating extensive, accurate and verified findings. By not adopting a simultaneous triangulated approach, you risk becoming susceptible to cognitive bias and ending up with blind spots that can prevent you from actioning some of the biggest customer problems that drive a superior user experience and higher financial returns. But by triangulating your findings through the use of a variety of qualitative and quantitative methodologies that provide both behavioural and attitudinal insights, you can avoid these pitfalls. This will increase the reliability of your results to provide the most accurate picture of the user experience, and give you the ability to solve your problems effectively.
To find out more about how best to triangulate your research strategy, feel free to reach out to us.