At Creative CX we are proud to be technology agnostic, which means we have a lot of experience with various analytics and testing platforms, and make an effort to learn the best way to conduct analysis within each.
When it comes to analysing a completed experiment we like to use all the platforms at our disposal to create an in depth analysis of visitor behaviours. Testing platforms can give top line information of KPIs and allow us to calculate significance, but using a platform like Contentsquare allows us to dig deeper into the behavioural metrics and understand why certain variants may have outperformed others.
Here is how we approach analysing a completed A/B/n test in Contentsquare:
1. Create test segments
The first thing to do is set up our test segments. Luckily, Contentsquare has some great testing integrations so most of the time this is pretty straight forward.
We go into the ‘Segment’ module, under ‘Define’, and create a new segment using the ‘Dynamic variable’ field:
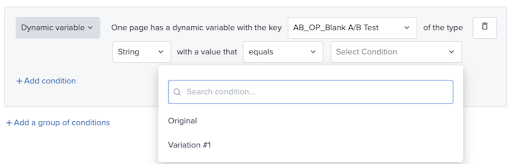
Once we have created a segment for each variable (and control) we’re good to start analysing!
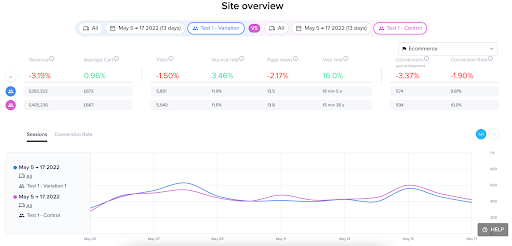
2. Site overview
Once we have created our segments we can dive into Site Overview to get a high level view of the difference between control and variants across the main KPIs. This can give an initial clue about whether certain variants have performed better or worse against the control before beginning to work out why this may be the case.
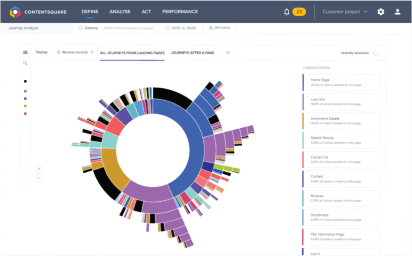
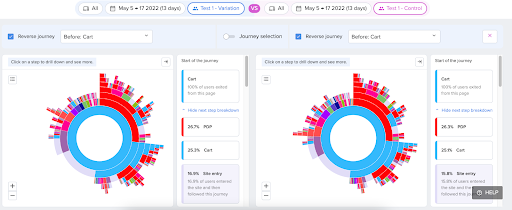
3. Journey analysis
We can use Contentsquare’s new side-by-side Journey Analysis feature to compare the journey of control visitors with the journeys of each variant to spot any patterns or discrepancies which may explain the performance. In particular we look for landing pages and subsequent pages, as well as pages with large exit rates.
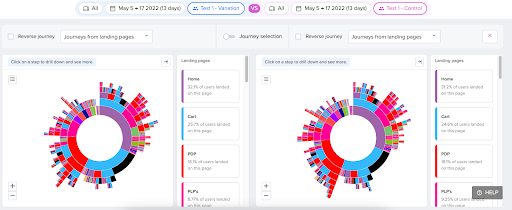
We can also dig into key journeys using the reverse journey feature to look at journeys leading to the checkout. Ideally, visitors should be able to move easily from PDP to cart to checkout. If we see multiple pages in a row, or looping between 2 or more pages, that might suggest a key stumbling point.
4. Page Comparator
We can further analyse on-page behaviour by using page comparator and comparing control and variant segments. By changing the page goal we see the share of visitors who move onto the next step or ultimately convert, but we can also see factors such as clicking a specific button.
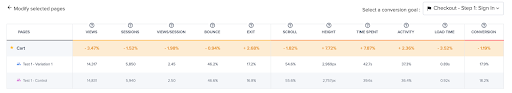
Large time or activity differences could highlight key differences in behaviours on the page.
| Higher activity | Higher time | Visitors are spending a long time interacting with the page. This could indicate more browsing or interest, but could also indicate difficulty finding the information they want |
| Higher activity | Lower time | Visitors are spending most of the time interacting with the page, and quickly accomplishing their goals. |
| Lower activity | Higher time | Visitors are spending longer on the page, but not interacting with the content. This could suggest they are spending more time reading the content that is here, but it could also suggest they are spending longer thinking about what to do. |
| Lower activity | Lower time | If visitors are moving through the page quicker, and interacting less, it could suggest they are finding it easier to move through the page with less friction. However, it could also indicate they are giving up sooner. |
We can figure out what the real story is by utilising the zoning tool.
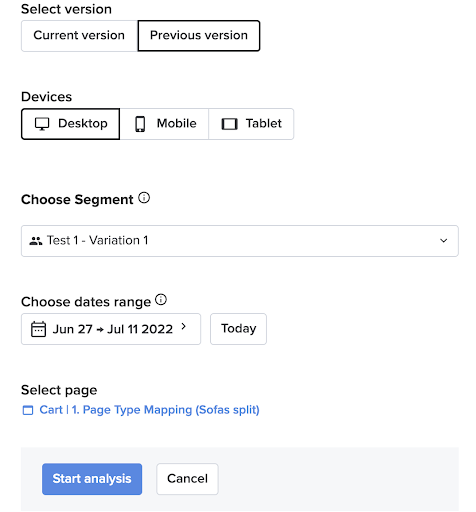
5. Zoning
Zoning is one of the most powerful tools in Contentsquare, and there are a number of ways to use this. If your test is live, and you are able to trigger each variation, you can use Contentsquare’s CS Live extension to zone live on your website. Otherwise, you can use the zoning tool in the platform and use the Previous Version method to trigger the right view by using the relevant segments.
In the platform we can also use the side-by-side zoning to compare the performance of control and variations on the same page, and see if there are any differences in behaviour.
Some of the typical metrics to look out for;
| Exposure rate | How far does each segment scroll? Are they missing any key areas? |
| Click rate | Which area of the page do visitors interact with the most? Is there a large difference between segments? |
| Time before first click | Which section of the page do visitors interact with first? Are they interacting with the sections in the expected order? Is there a large difference in time between subsequent sections which could indicate friction? |
| Conversion rate per click | Which elements of the page are driving conversions? Are there any unexpected elements? |
| Goal conversion rate per click | Which sections of the page are driving the most optimal behaviour? E.g we often see a higher PDP view rate on PLP filters. |
| Click recurrence | Are there any areas with a high number of clicks, which could suggest frustration? |
| Attractiveness rate | Are there any elements further down the page which may not been seen often, but are clicked a lot if they are? |
| Revenue per click | Which page elements are driving the most revenue? |
6. Session replay, Error analysis
Session replay can help to confirm the hypothesis you have built through the analysis, particularly when filtered on page events.
The new Error analysis can also confirm whether conversion issues were down to errors rather than the design itself.

7. Impact Quantification
The new impact quantification tool is a great way to measure the impact of your test, and potential long term impact if it was implemented.
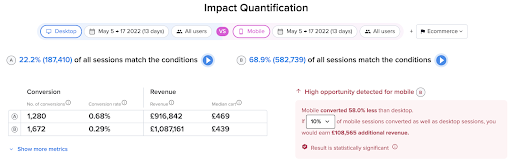
When comparing two segments the engine can automatically assess the difference between the two, and the potential impact of increasing the performance of one in line with the other. For example, here we see that if we improved just 10% of mobile visits to convert in line with desktop it could generate an additional £100k of revenue per month.
8. Upcoming features
Contentsquare are always upgrading and improving their platform, with lots of new features! There are some we are particularly looking forward to, but of course we don’t want to give the game away…
9. The next steps
Once we have analysed how and why a test was performed that’s not the end of the story. We use this analysis to inform whether or not a variation should be put live, and also further test ideas. We work with our clients throughout the entire test flow to generate and analyse potential tests, as well as live and finished tests. Utilising tools such as Contentsquare allows us to dig deeper and support our industry expertise with data and insights. Get in touch to hear more about our work and how we can supercharge your testing programme.