

When defining an experiment’s primary metric, the industry is divided. It may come as a surprise, but many businesses determine the success of their experiments based on the primary metric alone (we do not suggest this at Creative CX!). Accurately defining the primary metric is vital.
But first, what is a primary metric?
Simply put, the primary metric determines whether your experiment “wins” or “loses.”
Often, this metric is linked to a key performance indicator (KPI), which should be determined when defining the strategy of your experimentation programme. This method ensures that your experiments are always working towards achieving your top-level business objectives.
I’ll admit: the above sounds pretty simple. But in actual fact, there is much more to it, especially as everyone seems to have a different opinion on what your primary metric should be.
What should you set as your primary metric?
There are currently two stances in the industry on what a primary metric should be, which, depending on how a business defines its success, can create slight bias towards either.
A typical vendor or in-house team stance – micro-conversion rate optimisation
Your primary metric should always focus on the direct visitor action that is made on the same page as your variable change.
Following the above means your primary metric is most likely going to be a micro-conversion, with a micro-conversion being an action, or set of actions, which provides a strong indication that a user is progressing towards a valuable action on your website.
Benefits of this perspective
- More chance of gaining statistical significance with your experiments as the baseline conversion rate for these metrics are higher, therefore requiring a smaller sample size.
- Allows you to evaluate the success of an experiment using a primary metric that proves you have solved a customer problem, rather than relying on larger business goals.
- Does not limit the types of experiments you are prioritising in your backlog.
Limitations of this perspective
- Doesn’t place high emphasis on business metrics, meaning negative impact on these metrics could go unnoticed.
- More difficult to calculate ROI to prove an experimentation programme’s worth as this is often reliant on hard business metrics.
- Softer primary metrics such as micro-conversions are easier to improve, especially when not existing in the control. This may limit the complexity or maturity of your experiments.
- Unlikely to impact the overall user experience, but likely to delay the inevitable drop-off later in the user’s journey.
In our eyes, this stance places a higher importance on gaining significance and therefore learnings, than commercial value.
This raises an interesting question on whether experimentation and personalisation vendors often hold this perspective for reasons that best benefit their motives. With these platforms’ north star often being increased retention, having a higher significance rate among their customers would certainly influence engagement with their platform, positively impacting their north star.
For in-house teams, they often hold this perspective for similar reasons. We often find that the teams who have struggled to gain significance or winners with macro-conversion metrics, revert to this stance with pressure from their businesses to demonstrate value for their experimentation programmes. This “short-cut” solution means your experimentation programme is unlikely to have long-term success as you ignore the root problems of why you aren’t achieving statistical significance.
A typical agency stance – “chasing the money” style conversion rate optimisation
Your primary metric should always be your end conversion goal.
Following the above means your primary metric is going to be a macro-conversion, with a macro-conversion being the primary revenue driving action on a website.
Benefits of this perspective
- Easier to calculate ROI as all experiments are focused on increasing hard business metrics.
Limitations of this perspective
- Limits the type of experiments being run as every experiment focuses on improving conversion rates. No scope for other types of experiments like exploratory tests, minimum viable experiments (MVEs), experiments that aim to improve omnichannel goals, customer satisfaction, my account task success, and many others that are very valuable to a business.
- Risk neglecting aspects of user experience that are important to customers, but don’t immediately affect the business metrics. This can worsen user experience overall reducing the number of return visitors, overall satisfaction, and in the long-term, customer lifetime value.
- Short-term tactics to increase revenue can arise with focusing too much on business metrics. This can result in abandoning the iterative process, meaning fewer winners and learnings.
- Business metrics are typically lower – especially for e-commerce – and further down the funnel, meaning it is more difficult to gain significant results as a larger impact or sample size is required.
In our eyes, this stance places all the emphasis on improving the business metric which can result in us being too enthralled in chasing the money, implementing short-term tactics and missing what the underlying problem is for our customers.
This means our experimentation strategies can be counterproductive with many businesses taking a “test and dump” approach when expected business metrics are not improved. These short-term tactics not only limit our learnings resulting in fewer iterations and winners, but also limit any focus on long-term innovation and overtime sees businesses’ neglecting the customers they are supposed to be optimising for.
Our stance
Your primary metric should be the “end-point” that the customer problem you’re addressing has been solved, whether that is a positive behaviour change or a metric that indicates a mindset change.
We see the “end-point” being the completion of the task or mindset we are aiming to solve. Following the above means your primary metric could be a micro- or macro-conversion.
This stance is influenced by what we are trying to achieve for our clients. Our client’s customers are at the core of everything that we do, so each of our experiments revolve around providing the optimal experience whilst at the same time, ensuring this aligns with the business objectives.
Focusing too much on chasing the money for our clients neglects the customer experience, and for us, we see experimentation unlocking a whole other wealth of value beyond conversion rate.
Being customer-centric is key for long-term success and it’s important to remember that improvements to customer’s experiences can often directly impact our business metrics.
Taking this viewpoint allows us to ensure that we achieve the following results in tandem for our clients:
- Customers are the focus for all experiments we conduct even when we’re conducting a business experiment.
- Having customers’ task success as our primary metric means hard business metrics are closely aligned, increasing the likelihood of them being positively impacted. This allows us to still accurately calculate ROI for clients.
- We aren’t limiting ourselves to just typical web optimisation tests. Placing the customer at the forefront provides us the freedom to conduct other types of experiments that may be looking to explore future products, improve omnichannel goals or task success rates post-purchase.
Of course, this isn’t to say that our stance is without its limitations. However, we minimise these by following strict rules and guidelines throughout the experimentation lifecycle. One caveat is that our primary metric is never an engagement metric, especially ones that only exist in our variations, with the only exception being for add to baskets on e-commerce websites.
Let’s explain this further in an example:
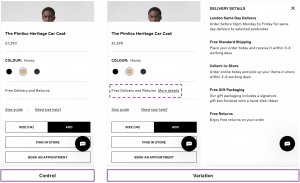
When analysing the data of one of our clients in the e-commerce space, we noticed customers were navigating to the delivery and returns policy information before making a purchase. This allowed us to deduce that some customers may need this information before adding a product to their basket.
We hypothesised that displaying delivery and returns information clearly on the product detail pages (PDPs) will provide customers with the information necessary to continue to the checkout process and we aimed to achieve this with a clearly labelled text link on the PDP that displays a pop-up with relevant information on engagement.
What should the primary metric be in this scenario?
Typical vendor or in-house team would state that the primary metric is the number of users who engage with the new text link, while the experimentation agency would focus on the conversion rate as their primary metric.
Each has its flaws, namely that they could lead us to misinterpreting our results, which would in turn lead to false positives – or negatives – that would be detrimental to the business’s bottom-line. Misinterpreting data would also prevent iterating on experiments, even though these iterations could lead to winners further down the line.
Applying the experimentation platform’s stance to the example
Valuing the number of users who engage with the new text link is very likely to produce a statistically significant result as it is a softer metric so easier to improve and not currently existing in the control. However, it wouldn’t take into account whether customer’s actions have changed further down the funnel, meaning a business might attribute more value on a positive primary metric result than they should. Without taking account of harder metrics, it will be difficult to make a business case on the results as they do not offer an ROI.
Applying the experimentation agency stance to the example
In this example, there would almost be too much emphasis on ROI. With the focus being on conversion rate, we would unlikely see a statistical significant result and would discount other benefits that may occur earlier on in the funnel.
Putting such a big emphasis on ROI would also limit the types of experiments that you could perform. In fact, if you went into experimentation only thinking of increasing conversions, it might not even occur to you that placing more delivery and returns information on the PDPs could help customers find the information they’re looking for.
Applying our Creative CX stance to the example
The primary metric for this experiment should be “add to baskets”. The customer problem is that users are not being served delivery and returns messaging at the correct point within their journey. Providing this information, or the ability to access it more easily on the PDPs, is only solving part of the problem. The strongest indicator that this problem has been solved would be whether users took a positive step as a result of being served this information. With research and data suggesting users look for this information before adding a product to their baskets, our primary metric would be the natural next positive step that users take.
If our experiment has solved this problem, we would expect to see “add to baskets” increase as a result.
What other important metrics should we be tracking?
Now you may be thinking: if all the focus is on the customer, how can our way of thinking help the business?
Firstly, our primary metric can still be a business metric if the end-point of solving our customer problem is the end conversion of the website.
Secondly, our experiment results have shown that solving customer problems has a positive impact on improving our business metrics. Through taking our learnings into iterations we often see significant improvements in business metrics as a result of removing customer problems.
Finally and most importantly, an experiment’s value doesn’t always come from whether your experiment is successful or not. An experiment’s value can take many forms, and we find that it actually often comes from the things we learn along the way, especially about our client’s users.
As a result, we believe it is important to track a number of different metrics in order to paint a fuller picture about how our users behave in each variation. This allows us to understand whether we have enhanced the customer’s experience. Even if we haven’t, our metrics should help us determine how we have hindered it, which can in turn help us understand how we might be able to fix it in another iteration. This ensures that further experiments are always focused on improving the customer’s experience.
Secondary metrics
These are metrics that provide insights about the overall business goals. These are typically business metrics like conversion rates, orders, revenue per visitor, return rates, average order value, and so on. They:
- Help you gather insights that are key to long-term success.
- Allow us to calculate the ROI for winning and implemented experiments.
- Allow you to track metrics further down the funnel.
Monitoring metrics
- Help track whether your experiment is truly moving visitors in the right direction.
- Uncover other opportunities, for example, other customer problems that can be explored through testing, which are completely unrelated to the primary metric
- Typically engagement metrics and funnel visits that allow us to gain deeper, more meaningful insights.
- Alongside any qualitative research we run in parallel, these metrics help drive our iterations.
Guardrail metrics
Guardrail metrics are essentially those you want to “guard,” i.e. any metrics you don’t want to negatively impact while you’re optimising your goal metrics. Keep these in mind when you read our next blog, which will be about defining your success criteria!
The importance of pre-planning your metrics
It is important to think carefully about your metrics before creating your variations and launching your experiment. The worst scenario you could get yourself into is running your experiment, beginning your analysis and then not being able to gain the full capacity of learning because you forgot to track something.
How many is too many?
You may be thinking at this stage “why don’t I just track every possible metric under the sun?” Well, depending on your experimentation platform, we actually advise against this for two simple reasons:
- It is unnecessary.
- It could hinder your statistical significance and therefore analysis.
If you don’t have a clear understanding of which metrics you should be tracking, this may be a red flag. To us, it would suggest that you don’t have a clear objective for your experiment, or it isn’t as clearly defined as it should be at this stage. In this case, it’s best to go back to your customer problem and ensure that you fully understand the issue you are trying to solve, as well as the solution your experiment is testing.
In addition, depending on your experimentation platform, you might be limited in terms of the metrics you can track. This is something to keep in mind when determining your metrics, as some platforms only allow a certain number of metrics before invalidating the statistical calculations they conduct.
Do you have any other metrics that you use to determine how successful your experiment is? If so, we’d love to hear about it. We’re always around on LinkedIn if you fancy a chat. And if you have some questions or require more information, feel free to reach out too!